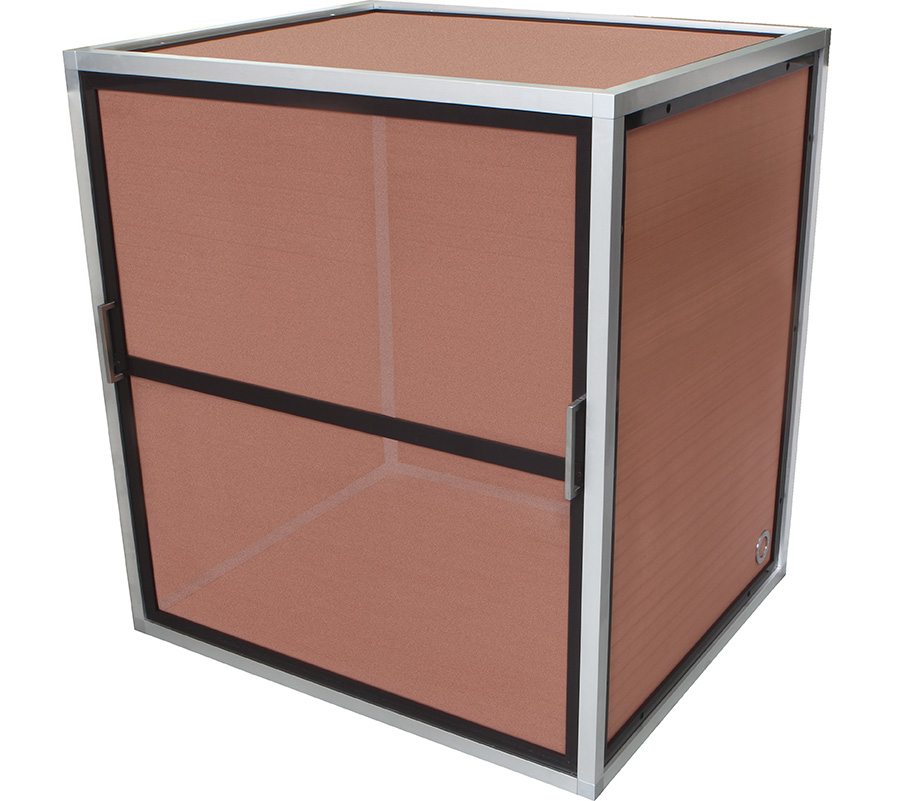
Picture of copper screen Faraday cage

The Survivalist’s Faraday Cage

  1. Context

Electromagnetic waves propagate freely in space. That’s how radios work. That’s how wireless phone chargers work. In 1962, a nuclear bomb set off in space killed Hawaii’s power grid. During the solar storm of May, 2024, people became aware that not only nuclear bombs but also solar storms could have high enough electric impulses to destroy the world’s power grid and the devices connected to that grid. How can electrical devices be protected from such catastrophes? Surge protectors such as those in many power strips have a limit to the energy they can absorb. The only way to ensure against large scale power grid surges is to disconnect from the grid and isolate the electrical device inside a conducting box – a Faraday cage. “But if the device is totally isolated inside a conducting metal box, of what use is it?” Great question! And the answer is: if a device is totally isolated, it’s useless until it’s pulled out of isolation. “Isn’t there a way to isolate a device and yet get information in and out of the box – say with a fiber optic cable?” Yes, but fiber optics are only good for carrying information, not power. “Surely someone has figured out how to surmount this problem.” Yes, they have, and you’re about to learn the secret!

2. Ordinary Faraday Cage

Imagine a conducting hollow sphere, a sphere made of gold, silver, or copper (the three most conductive metals). The electric potential anywhere inside the sphere is the same. It doesn’t matter what electrical potential or electromagnetic wave impinges on the outside of the sphere – the inside is electrically quiet. Now distort the sphere into the shape of a box. That box is a Faraday cage. The contents of the box are completely isolated from the outside world. Anything inside the cage is immune to electrical surges in the outside world. That’s why many spacecraft sent to radiation-intense regions (like the radiation belts around Jupiter) have most of their electronics inside metal boxes. They’re shielded.

Instead of using solid metal, what happens if one uses a mesh copper screen? One can see through a screen, so clearly high frequency electromagnetic waves (otherwise known as “light”) get through the screen. Low frequency electromagnetic waves do not go through the screen – the screen acts as a somewhat porous Faraday cage. For wavelengths that are long compared to the size of the holes in the screen, the radiation is blocked. A fine mesh screen might have sub-millimeter diameter holes. A coarser screen might have 1-2 mm holes. Consider that in free space, λν = c (wavelength times frequency = the speed of light). For a 1 mm hole, clearly a wave with a wavelength of 1 m has a much longer wavelength than the size of the hole, so the holes don’t permit much electrical potential to penetrate. Since c is about 3×10⁸ meters per second, a mesh screen looks solid for any radio frequency below 300 MHz. If the power grid is going to be taken down by an electromagnetic pulse, that pulse will have a wavelength much longer than 1 meter and so a frequency well below 300 MHz. For low frequency waves, that mesh screen not only acts as an effective shield, but also weighs a lot less, is easier to build, and is less expensive than solid copper. Picture of copper screen Faraday cage Image from web: http://www.standa.lt/images/catalog/b/1FC-faraday-cage.jpg

3. A Hole in the Cage

The key to running power cords, signal lines, or even air in and out of a Faraday cage is what a radio or radar engineer calls a stub antenna. Take a copper tube. It will have a diameter d. Cut it to a length 2d. 1” copper pipe? Cut a section 2” long. Half-inch conduit? Cut it 1 inch long. Put a copper flange on one end (probably by soldering, but perhaps by brazing). Bolt the flange onto the screen (or make a sandwich with the flange and the screening in intimate contact and bolts, nuts, or washers holding the sandwich together). The copper tube acts as a wave guide. Copper stub antennaHigh frequency radio waves, with a wavelength shorter than the diameter of the tube, will pass through tube unimpeded. But longer wavelengths? They’re cut off – the hole is too small for long wavelength waves to get through and the tube acts as a short circuit to any slight penetration of the waves. So those high-power electromagnetic waves that could kill the power grid? They can’t get in, and whatever’s inside is safe. For the really persnickety, wires passing through the stub antenna can be wrapped around donut-shaped ferrite cores to cut off even higher frequency waves, but a) the wires must be proximate to the ferrite within ¼ wavelength of the wave to be attenuated and b) the wires must be insulated from the ferrite. Thus ferrite is OK for extending the cutoff frequency slightly higher than c/d, but not by much. How do I know this? Supposedly, every electrical engineer runs into these concepts somewhere in their training. I learned it from an engineer named Paul Pressel. He worked for Bendix Corp., a company eventually subsumed into Allied Signal and now a long-forgotten memory. Most people never heard of him, but many know of one of his accomplishments. He designed the radar antennas for the Surveyor moon lander program. Surveyor was the first American spacecraft to make a soft landing on any celestial body other than earth. Five of the seven Surveyor spacecraft succeeded in landing. The two that failed did so for reasons other than radar problems (though Surveyor 3 bounced off the lunar surface because the radar didn’t turn off the rocket motors soon enough). Thus, when he explained to me how to run cables through Faraday cages without letting stray electromagnetic fields come along for the ride, I knew to take his advice! And now, so do you.

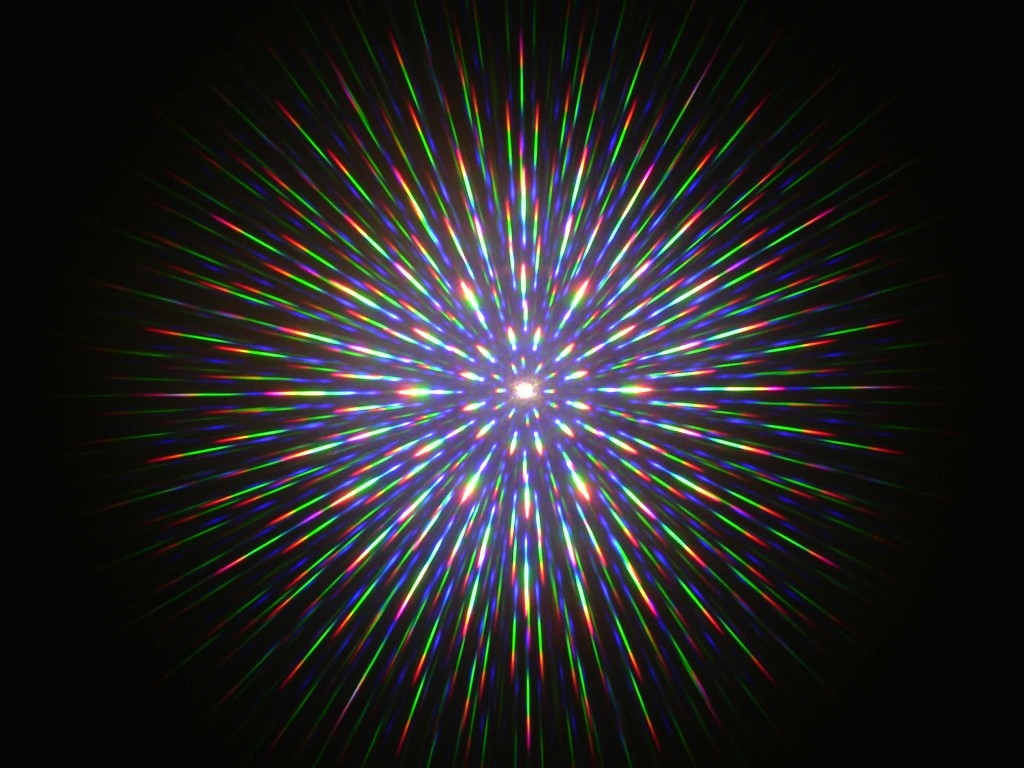
Double Axis Grating Solar Eclipse

SpectroBurstTM spectra are generated using stacked, mutually rotated gratings. Typically, the gratings are double-axis gratings, featuring diffracting spots spaced equally in the x and y directions. During the Great American Solar Eclipse of August 21, 2017, we at SpectroClick tried to get pictures of the eclipse through our gratings. The attempt through a Nikon D50 digital camera was a disaster; the images were blurry and useless. Pictures through a cell phone camera with a handheld SpectroBurst Viewer looked better, but still didn’t have the pizzazz we wanted. Fortunately, the second Great American Solar Eclipse occurred on April 8, 2024. The weather cooperated; in Olney, IL there was some high cirrus cloud but otherwise perfect clarity and temperature. We mounted a Samsung S20 5G phone on a tripod that was tall enough that we didn’t need to do contortions to see the display screen and make on-the-fly adjustments. A software package, SolarSnap, available for both Android and iPhone users, was well designed to capture images during both partial and full phases of the eclipse. Here we show a few of the images. Unlike most discussions of the eclipse, we use the solar images to elucidate how double axis gratings and spectrometers using such gratings behave. Interested in the science of the solar corona? You’ll need to look elsewhere!

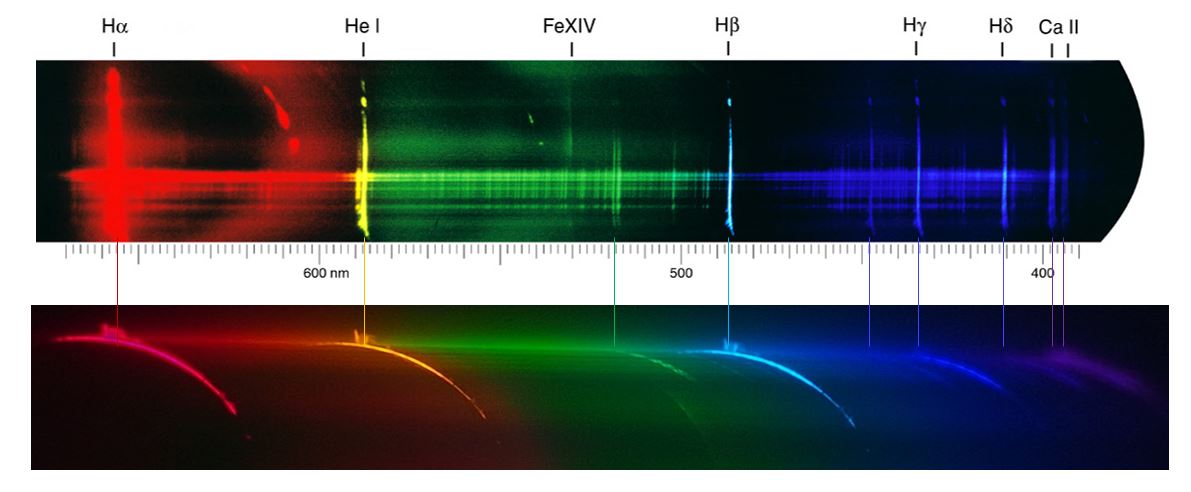
The solar spectrum is complicated. Stellarnet, another spectrometer company, has posted a video showing the changes in the sun’s spectrum going through a partial eclipse (their home base in Florida did not see totality). Have a look! They used an array detector and a smaller entrance aperture than we did. Small objects can be imaged with higher wavelength resolution than large objects. The sun is a fairly large object, subtending 0.5°. The corona is even larger; as its gossamer strands extend millions of miles into space, its apparent size depends on camera exposure. Students at the University of Montana Research Experiences for Undergraduates program got a beautiful image showing the corona’s spectrum during the 2017 eclipse.

Note that longer wavelengths are to the left in their image. Wavelengths of some of the prominent lines are: Hα, 656.3 nm (red). He I, 584.3 nm (yellow). Hβ, 486.1 nm (aqua). Hγ, 434.0 nm (blue).

Let’s look at an image of the partially-eclipsed sun through a double-axis grating, about four minutes before totality started:

At first glance, all 8 of the spectra dispersed from the crescent sun look very similar. However, the width of each spectrum is a projection of the crescent along the dispersion direction. The horizontal and diagonal spectra are narrower than the vertical spectra, and the wavelength resolution is poorer. Why? Because the dispersion direction where the light source appears smallest is in the vertical direction. It’s even cuter than that. Let’s do a cut and paste to put the upper and lower vertically-dispersed orders adjacent to each other and also paste the picture of the crescent sun adjacent to each spectrum.

Look carefully at the yellow section of the spectrum. In both cases, the curvature follows the curvature of the solar crescent. In the left-hand spectrum (from the upper part of the original image), yellow curves away from green towards red. In the right-hand spectrum (from the lower part of the original image), yellow curves from red towards green. If we averaged the spectrum across the width of the dispersed image, in the left-hand case, yellow (~585 nm) and redder wavelengths would blur. In the right-hand case, yellow blurs with green. This illustrates an important point about spectrometer design: image distortion blurs spectra, and whether the blur is due to the finite size of the light source, coma in the spectrograph, or distortion in the optics, resolution is NOT simply set by the dispersion of the instrument.

The images look grainy, don’t they? whether that is due to the cirrus clouds, weak signals that software scales to fill the 8 bit intensity depth of JPG images, or some other cause is not obvious. What is obvious is that noise is evident in the images. What isn’t so obvious is that ALL images contain noise; they look clean to humans only when the noise is low compared to the signal.

Now for the main event: spectra from the corona during totality!

The moon creates the dark hole in the middle of the corona. That hole can be seen in spectra that are not saturated (the two vertical spectra are saturated, and the hold is filled in). If we estimate that the corona extends across 1° of arc, then the first order spectra (horizontal or vertical) cover about 3° of arc and wavelength resolution is perhaps 75 nm. We can’t see individual spectral lines; we see only continuum or individual lines blurred across a significant fraction of each spectrum. The 21/2 orders (the diagonals) have slightly better resolution. But resolution as good as that Stellarnet spectrum? Not even close.

Why do SpectroClick spectrometers claim 5 nm resolution when these pictures obviously show nowhere near that resolution? The entrance aperture for our instruments is 50 μm across. That subtends an angle of about 0.1°. That’s about an order of magnitude smaller than the corona, so the resolution is an order of magnitude finer.

There’s a lot more detail we can pull from these images. See this PDF discussion that goes into those details.

Hofstadter, Ben-David et al., and SpectroClick


SpectroClick President Alex Scheeline

When I was on my honeymoon in 1984 with Alice, I took along Doug Hofstadter’s Gödel, Escher, Bach for beach reading. How cool is that? Changing your personal life and your professional life, all in 1.5 weeks of R&R close to Alexander Hamilton’s birthplace.

The essential idea of the Gödel Theorem from 1931 is that any symbolic system sufficiently complex to describe ordinary arithmetic is either logically inconsistent or logically incomplete. What that means is that there are some grammatically correct sentences (symbol strings, logical statements) whose truth cannot be ascertained (“The color of money is A flat minor.”) or logical statements that cannot be evaluated in an internally consistent manner (“The next sentence is false. The previous sentence is false.”). What this means is that laws, languages, and cultures are inevitably subject to illogic and inconsistencies, because language is a symbolic system and laws are expressed in language.

When we founded SpectroClick, one of our goals was to place a virtual expert analytical chemist into our operating software, so that non-experts would always have the benefit of expert thinking in making measurements with our instruments. Thus, the customer would always get a recommendation for useful action without having to deal with numbers, measurement science, instrument engineering, and so on. Of course we knew that Gödel’s Theorem was lurking in the shadows, but it seemed so remote that we didn’t consider it to be limiting.

However, on January 7, 2019 a paper was published: Shai Ben-David, Pavel Hrubeš, Shay Moran, Amir Shpilka, and Amir Yehudayoff, “Learnability Can Be Undecidable,” Nature Machine Intelligence, 1, 44-48 (2019). The paper maps machine learning to the Gödel theorem, showing that for certain sets of information, a sampling of the information cannot give a model of the system sufficiently nuanced that a model of the system can describe its entire functioning.

Let’s look at a couple of examples not described in the Ben-David paper. The first is a system of two, isolated bodies (say a star and a single planet orbiting that star) interacting only via gravity. Newton’s Law of Gravitation (or, in some cases, Einstein’s Special Relativity modification to Newton’s Law) can be applied to short term data to predict the behavior of the system for all future time. That is, observing the system for a short time provides everything one needs to know to understand it for all time.

In contrast, suppose the system we’re looking at is the behavior of people in Champaign, Illinois. We can talk to many of these people and develop a model of how each person behaves and how all the people we’ve met will behave. While that may provide a vague idea of how the other people in town will act, our model of human behavior can not be extrapolated. We cannot predict how the people we haven’t spoken with will act. If our subset is only people without steady jobs, we know nothing about how fully employed people will view reality. Conversely, if we only talk to people who live in McMansions whose mortgages are paid off, we have no idea how people with different economic means will view reality.

Aside: my humanities-degreed wife initially commented on the survey example, “the study was badly designed; biased sampling will always give a biased result.” The point of Ben-David et al. is that, in all but the simplest situations, there is always a bias if there is less than 100% sampling.

The Ben-David et al. paper discusses the theory of machine learning. They show that machine learning is based on sampling a set of information, abstracting patterns in that information, and then extrapolating when presented with novel inputs. Given that the information set is a statistical sampling of some part of the real world, any machine learning will run into situations, per Gödel, that cannot be accurately evaluated. There are limits to machine learning and intelligence.

People can be modeled as one variety of learning machine, a neural network, who learn from their environment. Separately, some day, I hope to explain why humans can never know everything – the amount of information we can each absorb is bandwidth limited. But if we are learning machines, then we too are learning by sampling the data in the real world and the patterns we discern are limited in the manner Ben David et al. recognize. Our models of the world are always incomplete and inconsistent.

And this brings us to SpectroClick and the codification of analytical chemistry and spectrometry. Our strategy for providing people with action recommendations rather than just raw scientific data presumes that we can codify each user’s problem and environment, and then develop a method to solve the problem in that environment. We would anticipate many (or all) the complications one might encounter in carrying out the method, and make video instructions to show users how to proceed to a worthwhile answer. We can test our level of problem anticipation by having inexperienced users try our methods. But now Ben David et al. essentially tell us that we cannot anticipate all the problems because our sampling of customer behavior will be incomplete, as will be the information available to our programs. Therefore, there will always be circumstances we either cannot sense or cannot anticipate.

Perhaps this even exposes what we mean by innovation. If we know inputs and outputs for a particular situation, we have an algorithm, i.e. a statement that, given thus and thus inputs, do a fixed set of operations to give an output. How do we judge if an output is sensible or anomalous? By comparison to experience and expectation. What if an output is not sensible? At some point, an algorithm runs out of options and terminates saying, “this doesn’t make sense and none of the tools to which I have access tells me what to do.”

But an innovator can say, “since we know the existing approaches fail, we need to see where the anomaly occurs, what could lead to that anomaly, and rethink the context of the problem.” The ability to jump outside the system constraints to form a supersystem (thank you, Doug Hofstadter!) is what an innovator does. From the broader perspective, additional refinement of the algorithm may be possible; the dead ends turn into branch points to additional activity. Ben David et al. imply that one never gets to the point where any sufficiently complicated activity is fully containable within an algorithm. Humans interacting with the natural world is probably so complicated that the Ben David et al. argument describes the problem and enlightens us about the solution. SpectroClick may build ever more sophisticated subsystems that help a wider and wider range of people, but we will never get to the point that we function flawlessly for everyone. The question is: will we work well enough for enough people to become a thriving business. Stay tuned!


It’s Right! It’s Wrong! It’s Approximate!

SpectroClick President Alex Scheeline

We here at SpectroClick know a thing or two about diffraction gratings. They are a component in the SpectroClick Kit, and you look through two of them in a SpectroBurst™ Viewer. The particular arrangement we use in the AAH-300 spectrometer is its “secret sauce”. Your intrepid blogger has been using diffraction gratings for three quarters of his life. What actually happens when light goes through, or transits, a grating? Lately, I’ve been obsessed with modeling the path the light takes.

The interference pattern consequent to light interacting with a structure having periodic variations of distance d results in light appearing at an angle β when

n λ = d(sinα + sinβ)   (1)
Reflection grating schematic

Figure 1. Reflection grating, showing ruling spacing d, entrance angle from the normal α, and three diffraction angles βblue, βgreen, and βred for three wavelengths. Positive angles are measured counterclockwise from the grating normal.

Here, n is an integer, λ (Greek letter lambda) is the wavelength, d is the spacing of grating rulings, α (Greek letter alpha) is the angle of incidence between the normal to the grating (the normal is perpendicular to the plane of the grating), and β (Greek letter beta) is the angle between the normal and the exiting, visible beam. Even if you don’t know any trigonometry, you can punch the “sine” key on your calculator to compute the sine of α and the sine of β. To keep this blog entry from going on interminably, if you want to know what sines are, go check them out at https://www.mathsisfun.com/sine-cosine-tangent.html or some other website.

If n=0, a reflection grating acts like a mirror. Mirrors have the property that the angle of incidence (α) equals the angle of reflection (β). A first look at equation 1 seems to contradict what “everyone knows” about mirrors. But be careful about signs (aren’t you glad you’re reading this? Sine and sign are homonyms.). The magnitude of α and β are the same, but their signs are opposite. Since sin(-x) = -sin(x), equation 1 works provided all angles are measured in the same direction. Thus if α =+10°, β = – 10° or +350°. There’s a riddle for you: “When does -10 = + 350? When you’re measuring angles.”

What happens with transmission gratings? When we published the instruction book for the SpectroClick Kit, in the discussion at the top of P. 10 we went through three versions. The first version was correct, but we didn’t recognize it as such. The second version was a pretty good approximation, but we didn’t immediately see that it was an approximation, and the third version (what we now have uploaded to the site at https://www.spectroclick.com/wp-content/uploads/2018/02/SPECTROCLICK-KIT_Instr_02_13_18.pdf) gets it right. So let’s look at the three versions.

Version 1. Transmission grating and rotated transmission grating

Transmission grating geometry

Figure 2. Transmission grating analog to Figure 1. Vagueness in the drawing reflects the author’s intentional fuzziness at the time the first Kit instruction booklet was issued. “β” applies to each of the colored rays. The variable θ does not appear in the figure; it is the angle between the entering ray (heaviest black line) and the grating normal.

In the original manual about the SpectroClick Kit, we wrote down the grating equation as

n λ = d(sinα – sinβ)   (2)

I figured that sign conventions were a nuisance to students and being able to say “in zero order,
α = β” seemed like an easy short-cut. What if the grating was rotated so that the incoming ray was not normal to the grating plane? I recalled the derivation of how a Czerny-Turner plane grating spectrograph works. There, when the grating is operating in zero order, the incidence angle is η (Greek letter eta), and as the grating is rotated to an angle θ, the wavelength visible at the exit slit of the spectrometer is

n λ = 2d sinθ cosη   (3)

I figured if anyone cared to rotate the grating, they’d see something that looked approximately like equation 3, didn’t think the trigonometric derivation was worth the time, and moved on.

Version 2. Rotated transmission grating ignoring out-of-plane behavior

I then looked at a grating that I rotated. Rather than scanning the diffracting pattern, moving away from θ = 0 showed that the diffraction pattern stretched. The steeper the rotation angle, the wider the diffraction angle. That seemed curious, and I tried to see if there was a simple explanation. I put my hand in front of my face with my fingers pointing up and my palm perpendicular to my line of sight. The fingers were analogous to the grooves of the grating and the plane of my palm served to show the plane of the grating. As I rotated my hand, I could see the fingers, projected onto the plane on which they were originally located, seemed to move closer together. In a flash, I saw:

dapparent = d cosθ   (4)

I did a quick experiment in the lab, and to a decent approximation, that looked good. So the second version was published saying

n λ = d cosθ sinβ   (5)

For small rotation angles, this worked well. I didn’t worry about large angles. The diffraction angle β was not measured from the grating normal – it was measured from where the normal is when θ = 0.

Version 3. Transmission grating with our signs straight

The professional instrument being developed by SpectroClick is the AAH-300. It uses a stack of diffraction gratings, and so rays that are diffracted by the first grating are rediffracted by the second grating. For that grating stack to be accurately calibrated, one must be able to handle rays that arrive at the grating at an off-axis angle. This is completely analogous to rotating the grating. The best calibration approach we have used to date was cited in a paper we published in 2016:

Scheeline, A., and Bui, T. A. (2016). “Stacked, Mutually-rotated Diffraction Gratings as Enablers of Portable Visible Spectrometry.” Appl. Spectrosc., 70(5), 766–777.

Therein, we cite an elegant approach to describing grating operation (primarily reflecting gratings) when they are illuminated at any off-axis angle:

Harvey, J., and Vernold, C. L. (1998). “Description of Diffraction Grating Behavior in Direction Cosine Space.” Appl. Opt., 37(34), 8158–8160.

In the Harvey and Vernold article, the authors state that behavior is non-linear for large diffraction angles. This led me to think about how to deal with transmission gratings. Along the way, Prof. Harvey was kind enough to send me some draft book chapters that expanded on the above cited article and explicitly dealt with transmission gratings. Suddenly, it became clear to me that “0°” was the normal to the grating on the side where the beam exits. That means that if the entering beam is normal to the grating plane, it is not at 0° inbound, it is at 180°! That means that when the grating is rotated, we have to choose whether we measure the angles α and β from the grating normal or from the original direction the beam was traveling. We can do either, because the light beam has no clue what reference axis we’re choosing. To keep from having to use subscripts, let’s continue to measure α and β from the grating normal, θ from the normal to the grating when that normal aligns with the incoming/outgoing light axis in zero order, and then define a diffraction angle γ (Greek gamma) which is the angle the diffracted ray takes vs. the entering ray. If θ=0, then γ = β while α = 0. Keeping the signs straight, as per equation 1,

n λ = d(sinα + sinβ)   (6)
= d(sin(180° – θ) + sinβ)
Transmission grating with angles referenced to zero order

Figure 3. Transmission grating with grating rotated. θ + α = 180°. θ and γ are identified with orange lines, while β is shown with a violet line. α is identified with an arc from the grating normal to the incident ray.

“Where’s γ? Where’s cosθ?” I’m glad you asked – but we’re not there yet! We need to use some trigonometric identities to get there.

First, use the sine of a sum rule:

sin(a+b) = sin a cos b + cos a sin b   (7)
sin(ab) = sin a cos b – cos a sin b
sin(180° – θ) = sin 180° cosθ – cos180° sinθ = 0 cosθ – (-1) sinθ = sinθ   (8)

We simplify equation 6 to read

n λ = d(sinθ + sinβ)   (9)

Now comes The Trick! When we rotate the grating, γ no longer is the same as β. In fact,

β = γ + θ   (10)
n λ = d(sinθ + sin(γ + θ))   (11)

We use the sine sum equations again.

n λ = d(sinθ + sin γ cosθ + cosγ sinθ)   (12)
= d cosθ sinγ + d sinθ(1 + cosγ)

The first term on the right side of the second line in equation 12 has exactly the form of equation 5, the equation that appeared in the second version of the SpectroClick Kit manual. What about the second term? For small angles, cos(angle) ~ 1, so the term is ~2dsinθ. If θ is small, so is the second term, and at least for small values of γ, nearly independent of wavelength. Thus, to a close approximation, equation 5 is descriptive, but it’s not perfect. How big is the error? With the 500 line per mm grating in the SpectroClick Kit (d = (1/500) mm = 2 μm = 2000 nm), using the blue 460 nm wavelength of the bright blue spike, let’s tabulate how far off equation 5 is. For first order,

θ (degrees) β from eq. 9

(degrees)

γ from eq. 10

(degrees)

β from eq. 5 (should equal γ)

(degrees)

Approximate/Exact γ
0 13.30 13.30 13.30 1.000
10 3.23 13.23 13.51 1.021
20 -6.43 13.57 14.17 1.044
30 -15.66 14.34 15.40 1.074
45 -28.50 16.50 18.98 1.150


If we are looking at the spectrum with a camera or by eye, γ is the most natural way to look at the information because we can see where γ=0 occurs (zero order). If we use eq. 5, it’s not exact but up to θ=45°, it’s accurate within 15%. How accurately can you measure an angle? Can you see an error of ½ degree? Probably not. Can you see an error of 2.5 degrees? Maybe. The trend that bigger θ gives a bigger diffraction angle is consistent throughout.

As I write this, I think about the video we posted concerning nonidealities of the SpectroClick Kit, SPECTROMETER NONIDEALITIES, Part 1, SPECTROMETER NONIDEALITIES, Part 2. We show equation 5 there. Now we all know that equation 5 is inexact. Should we revise the video? Are the calculations so much more complicated for the exact approach that an inexact but approximate relationship is better for beginning students than a more exact but complex approach? Are we perpetuating misconceptions if we leave things alone? These are interesting and important pedagogical issues.

Copyright © SpectroClick 2018

A Light at the Smithsonian

SpectroClick President Alex Scheeline

The Smithsonian Institution’s National Museum of American History, on the national mall in Washington, D.C., has an exhibit on Thomas Edison that includes the development of electricity and lighting, and, more generally, invention (http://americanhistory.si.edu/lighting/). One area that I saw in late 2017 had a set of lamps, including a low-pressure sodium vapor lamp, a mercury lamp, an incandescent lamp, and a compact fluorescent lamp. Here is a close-up of part of the exhibit:

As shown by the captions under each lamp in the picture, the emphasis of the exhibit is on energy efficiency. The low-pressure sodium vapor lamp puts out the same amount of light as the mercury vapor lamp or incandescent lamp but at lower power. However, the first thing a spectroscopist notices is that the perceived color of each lamp is different. My instinct was to look at the exhibit through a diffraction grating. And, thanks to having a SpectroBurst™ Viewer at hand, I had one! In fact, I had two, but I chose the 500 line per millimeter linear grating (blue frame in the Viewer set). While I had located incandescent lamps, fluorescents, and high-pressure sodium vapor lamps around our neighborhood in Champaign, I had yet to find a low-pressure sodium vapor lamp to observe for comparison with its high-pressure cousin. Here was my chance! Low-pressure sodium vapor lamps emit the sodium doublet at 588.9 nm and 589.5 nm rather than a broad continuum as comes from high pressure sodium vapor lamps. What do the spectra look like?

First, here’s a picture of your intrepid blogger taking a picture without a grating.

Second, I’ll show the unannotated picture of the exhibit through the grating. Then I’ll mark it up and describe what is seen.

This looks messy, because there are many spectra generated from the three different lamps. There are multiple images of the sodium vapor lamp. The mercury lamp puts out spectra to left and right (since the camera was mostly centered on the mercury lamp). From the right, there are continua from the incandescent lamp. Around the edges are spectra whose source and identity aren’t immediately obvious.

So I marked off all the lines I could identify. Here they are:

The yellow lines relate to the low-pressure sodium vapor lamp, the light blue bands identify light from the incandescent lamp, and the green lines relate to the mercury lamp. There are additional continua from the incandescent lamp to the right of the field of view. Let’s dissect these spectra.

Low-pressure sodium vapor lamp (identified with yellow lines)

At the left, middle, is zero-order for the sodium vapor lamp. Because the lamp is large, the 588.9 nm/589.5 nm doublet cannot be resolved. From the center of the zero order image to the center of the first order image is about 3/8 of the picture width, and second order is another 3/8 of the way across. As one would expect, the space between orders is about the same. Where’s third order? It’s off to the right of the field of view.

Near the bottom of the picture, there’s a reflection of the light from the lamp. And sure enough, first and (weakly) second order show up as the grating disperses light from the reflection as well as from the original lamp.

The diffraction orders are tilted to make for easier annotation (I was thinking ahead). If I had rotated the grating about 5° clockwise, the orders would have been dispersed parallel to the horizontal edges of the photo, but then distinguishing some orders from each other would have been more difficult.

Incandescent lamp (identified with blue lines)

Zero order shows a highly saturated image of the incandescent lamp. First order (with the visible range marked in the image) comes not only from the filament but also from glints off the glass envelope of the bulb. There is a weak second order spectrum farther to the left but I left it unmarked because the mercury arc lamp and sodium vapor lamp give more prominent features in this region. But can you see the continuous spectrum there?

Mercury arc lamp (identified with green lines)

Analyzing these lines is pretty simple at first. Then there’s a head-scratcher. But once the clues are evaluated, the problem solves itself in a flash!

Look up the neutral mercury spectrum with your favorite search engine, and you’ll find the brightest mercury lines are:

Wavelength (nm) Color
 404 nm  Violet
 435 nm  Blue
 546 nm  Green
 579 nm  Yellow

Sure enough, all four of these lines are easily visible from the mercury arc. But there’s a light blue line about half-way between the 435 nm line and the 546 nm line, and there’s also some red light there. What’s going on? It isn’t mercury emission. I looked at the NIST wavelength charts. A lot of mercury lamps have an inert gas fill to help the lamp ignite; argon is common, helium, neon, krypton, and xenon less so because they are more expensive. The argon ion laser emits light at 488 nm, and I almost got suckered by that fact. However, I got to thinking,

Argon ion only shows up when the gas pressure is low and the electron density is high. That doesn’t sound like a mercury lamp. Furthermore, the emission line that gives rise to the laser is only intense when there is a laser cavity surrounding the plasma so that stimulated emission, not spontaneous emission, dominates light production. Furthermore, the bright argon neutral atom lines near 472 nm aren’t there. This just doesn’t make sense.

Upon further reflection, I went back and thought about this a bit more carefully. I interpolated the wavelength of the light blue line. Moving horizontally for + 1st order,

Line Position (pixels)
435 nm 728
Blue unknown 754
546 nm 778

So let’s do linear interpolation.

(754-728)/(778-728) = 0.52

0.52*(546-435) = 58 nm

435 nm + 58 nm = 493 nm

We assume that dispersion is constant everywhere (a poor assumption, even in the best of spectrometers), so if we’re off by a few nanometers, that’s plausible. What common gas emits near 490 nm? And then it hit me. Bohr atom! Hydrogen atomic emission! Blue-green line (H beta) is at 486 nm, and the red (H alpha) line is at 656 nm! 656 nm is red, and lo and behold, there’s red light in this spectrum! While I can’t prove it without a better calibrated instrument and better resolution, it sure is a simple answer to say there’s hydrogen in this mercury lamp.

And that, ladies and gentlemen, is how one uses atomic emission spectroscopy for qualitative analysis.

So now we can label each line. To keep the image clean, use this concordance to link each labeled feature to its corresponding meaning.

Line Label
A Sodium vapor lamp, zero order
B Sodium vapor lamp, 589 nm, first order
C Sodium vapor lamp, 589 nm, second order
D Reflection of sodium vapor lamp, zero order
E 589 nm first order image of reflection of sodium vapor lamp
F 589 nm second order image of reflection of sodium vapor lamp
G Zero order, incandescent lamp
H Blue end of first order, incandescent lamp
I Red end of first order, incandescent lamp
J Zero order, mercury lamp
K First order 404 nm mercury
L First order 435 nm mercury
M First order 486 nm hydrogen
N First order 546 nm mercury
P First order 656 nm hydrogen
Q Second order 404 nm mercury
R Second order 435 nm mercury
S -1 order 404 nm mercury
T -1 order 435 nm mercury
U -1 order 486 nm hydrogen
V -1 order 546 nm mercury
W -1 order 579 nm mercury
X -1 order 656 nm hydrogen
Y Zero order, reflection of mercury lamp
Z First order 404 nm mercury from reflection of lamp
a First order 435 nm mercury from reflection of lamp
b -1 order 404 nm mercury from reflection of lamp
c -1 order 435 nm mercury from reflection of lamp
d -1 order 486 nm hydrogen from reflection of lamp
e -1 order 546 nm mercury from reflection of lamp
f -1 order 579 nm mercury from reflection of lamp

Once again, serendipity has reared its head (see my TEDxUIUC talk). I went to the museum to get some material for my blog, but what you’ve read here wasn’t what I was looking for. When I was a postdoctoral fellow in 1978-1979, I visited the same museum, and at that time there was an exhibit with Henry Rowland’s original grating ruling engine – complete with a foot switch to step on so I (or any visitor) could rule the next groove on a piece of speculum metal. I figured description of early grating ruling engines, grating replication and how holographic gratings are now replacing ruled, replica gratings in many cases would make an interesting blog post. But look what happened instead!

The SpectroClick Origin Story Part III : A New View of Serendipity

SpectroClick President Alex Scheeline
The day the Vietnam National University of Science – Hanoi students first worked on assembling their rudimentary spectrometers was May 21, 2009. Because of all the chatter in the classroom, I thought they understood the task and were highly involved. Not until two years later did Bùi Anh Thự inform me that, in fact, the students were highly confused, didn’t know what was happening, and didn’t feel they were learning much. But at the time, it looked like they were playing with positioning the components, aligning the spectra in their cameras, and learning a lot.

I asked the students to transfer their data to thumb drives and bring them to class the next day, when we would go over how to analyze the data. What I didn’t realize was that some students had discarded used components on the floor, leaving them as trash. And what I also didn’t know was that Thự was intrigued by the diffraction patterns and wanted to create more patterns, so that at the end of class she went to the back of the room and harvested many of the discarded batteries, LEDs, and, most importantly, diffraction gratings. She took them home, waited for sunset, and started playing with them in a darkened room.

DOUBLE DIFFRACTION GRATING
RL5-W5020 white LED, powered by a 3 V lithium battery, as observed through a double-diffraction grating. Bùi Anh Thự, May 21-22, 2009.

At the beginning of class the next day, Thự was the only student who brought in data. I looked at one of the double-dispersion pictures of the LED, which she took against a dark background. “Could I use this in discussing the data with the class?” I asked. “Yes,” replied Thự. And so it was that during the second hour of class, Thự’s double-dispersion image was projected for all to see. We reproduce it here as the DOUBLE DIFFRACTION GRATING image. As Prof. Thai videoed the proceedings, I started discussing the image, and loaded it into the data analysis software. While the screen of Thự’s data wasn’t captured while in Hanoi, a screen showing spectra for blank and absorbance of Methylene Blue appears below to give some idea of what was being projected.

METHYLENE BLUE SPECTRUM
Data analysis software used with the “cell phone spectrometer” experiment. Image originally published in the Journal of the Analytical Sciences Digital Library, entry 10059, open access (2009).

It dawned on me that I was seeing something unusual, something that might solve a problem of long-standing. As the order number increased, the throughput went down, but the dispersion increased. Thus, there was a trade-off among resolution, throughput, and dynamic range.

I did not recognize at the time that control of exposure time was a problem. In 2009, simple “point and shoot” cameras and early cell phone cameras automatically adjusted exposure to maintain a pleasing appearance, thus destroying the ability to measure the absolute intensity of light. Since that time, exposure control has come to the software systems used by widely available digital cameras. But back then, I only vaguely understood and explained the exposure problem to the class.

I then said, “If we could figure out how to get a lot of orders to look at, we could optimally trade off throughput, resolution, and dynamic range.” This trade-off had hounded users of array detectors since their invention in 1973. At which point, Bùi Anh Thự quietly said, “Show the video!” “Video? What video?” I thought, in a state of confusion because I had seen only the still image from the double dispersion grating.

Thự came to the front of the room and opened a second file from the thumb drive. The video she shot the evening before looked at light transmitted through several gratings, one adjacent to the LED, the other two just in front of her camera lens. It showed some of the most glorious multi-order spectra imaginable. She had also taken some stills, the best of which, what I consider to be the founding image of SpectroClick, is shown here:

STACKED DOUBLE DISPERSION GRATINGS
LED viewed through 3 stacked double-dispersion gratings. Taken by Bùi Anh Thự
May 21-May 22, 2009, and displayed to the K51 class, Hanoi University of Science Faculty of Chemistry, May 22, 2009.

It was hard for me to finish class after seeing the multi-order spectral pattern for the first time. Keep in mind that all I expected to see was an image like the first DOUBLE DISPERSION GRATING image above, but instead I saw the complex array with the capability of solving the long-standing instrumentation performance trade-off problem. At the end of class, I stepped off the dais, walked straight to Thự, and said, “We’ve got to protect your intellectual property rights. You just made a patentable invention.” She responded in disbelief, “I did?”

Over the following days and weeks, the Faculty of Chemistry and Hanoi University of Science indicated no financial or equity interest in the invention. We filed a disclosure with the University of Illinois. By late fall, I sent a small optical bench to Thự in Hanoi so she could work with the diffraction gratings to get an understanding of how they function, which neither of us understood at the time. While still an undergraduate, Thự came to Champaign-Urbana for ten weeks in the summer of 2010 to work on moving from an ingenious idea to a user-friendly instrument.

The initial spectrometer that I designed in the spring of 2010 failed – I hadn’t recognized that the LED makes a virtual image behind the grating, and the camera lens is central to imaging. Thự straightened this out, and Rob Brown of the School of Chemical Sciences Machine Shop machined a more plausible design (jointly designed by Bùi, Scheeline, and Brown). By mid-July of 2010, we had an arrangement that has since been the core of SpectroClick’s hardware technology.

Unlike any precedent spectrometric approach, dynamic range is not limited by detector dynamic range. Bùi Anh Thự broke a 36-year-old logjam, and is thus co-founder of SpectroClick. She returned to Urbana-Champaign in the fall of 2013 to continue instrument development. That year, we won the FACSS Innovation Award, recognizing this new technology. Bui Anh Thu now lives in Hanoi, Vietnam and is Program Coordinator at Newton School, an international high school with instruction in both Vietnamese and English.

Company founders Bui Anh Thu and Alex Scheeline, EnterpriseWorks, Champaign, IL, after winning the FACSS Innovation Award, Fall, 2013

SpectroClick, Inc. was co-founded by Scheeline and Bùi on September 11, 2011. United States Patent 8,885,161, “Energy Dispersion Device,” was granted to Alexander Scheeline and Bui Anh Thu on November 11, 2014.

Technology Tidbit 1. SATURATION and DYNAMIC RANGE DISCUSSION

As shown in DOUBLE DIFFRACTION GRATING, it is obvious that the image is saturated in the central, zero-order image of the LED. It is less obvious, but true, that several of the first-order images (the eight images of the LED, showing some “rainbow” effect around the central white dot) are saturated in part, but the red end of the spectrum is not saturated. In the analysis software, it was clear that such reduced saturation occurred, and that the second order spectra (even further out) were out of saturation.

Ever since working in Stan Crouch’s lab at Michigan State University in the 1970s, I’d been taught, and then taught my students, that one needed diode arrays with deep wells to do absorption spectrometry because of the precision required in measuring intensity and intensity ratios. But here was a way to get dynamic range from having many orders to choose from simultaneously. But what about precision? As the order number increased, the amount of signal averaging one could do also increased! So close to 100% T, one could average information from the high orders, getting good resolution and a good reference intensity, and then when a sample was in place, at high %T, the same pixels could be used to measure transmittance. If absorbance was high, the previously saturated pixels would come out of saturation, so that lower resolution could be used to allow precise measurement of the lower intensities.

Technology Tidbit 2. SPECTROBURST™ SPECTROSCOPY DISCUSSION

SpectroBurst™ spectroscopy uses the 12-fold symmetric set of orders to provide a wide range of throughput in a single exposure, so that the dynamic range of the system is the product of the dynamic range of the detector and the grating throughput. Resolution depends on optical aberrations, entrance aperture size, light collimation prior to the grating, and focusing of the camera. Whether resolution is set by the optics or by the size of observation pixels depends on the specific system. Unlike any precedent spectrometric approach, dynamic range is not limited by detector dynamic range.

The SpectroClick Origin Story Part II: Return to Hanoi

SpectroClick President Alex Scheeline

In the fall of 2008, as I was gathering parts and writing software for the rudimentary spectrometer at the University of Illinois at Urbana-Champaign (UIUC) to take to Vietnam National University of Science – Hanoi for the Chem 420 class, I started working with the EnLIST program. EnLIST sought to assist Illinois high school teachers in becoming more effective in the classroom, and they looked forward to training their first cadre the following summer. Teaching assistant Kathleen Kelley was assigned to help prepare the labs. We decided to also use the spectrometer with the EnLIST participants. My “single use” rudimentary spectrometer, originally dreamed up for one-time use in Vietnam, had additional users even before the first mock-up was completed.

We needed to figure out how to connect a battery to the LED light source. Kelley went to the Electrical Engineering storeroom to select a battery and battery holder. She returned with a lithium button battery just the right size so that friction would hold the LED in place. “Brilliant! One less part to worry about, and we don’t need to solder!” I said. The internal resistance of the battery and the exponential response curve of the LED just balanced, giving a stable light source.

By April 2009, I had prototype software running to interpret the JPGs from the rudimentary spectrometer. A key contribution was that of UIUC Chemistry Professor Emeritus Stan Smith, one of the originators of computer-assisted instruction. Because we couldn’t trust how the cameras would line up with the spectra, the students had to tell the software where the data lay. “How do I extract data situated at an angle?” fussed and thought, and then asked Smith for advice. Drawing the problem on a white board, I showed Smith the image rotation problem. Smith put up his hand at an angle and twisted it straight. “Just rotate the picture until the line you’re trying to extract starts at a known place, going in a known direction,” he said. In the blink of an eye, the problem was, in principle, solved. After a few days of programming, semi-automatic data extraction was a reality.

As I prepared to leave for Hanoi, I wasn’t sure if I could take the lithium cell batteries by air to Vietnam. After a bit of inquiry, including talking with personnel at American Airlines and the Transportation Safety Administration, it appeared that as long as the batteries were in their original packaging and in carry-on baggage, it was permitted. I took an additional step: after I received the parts, I didn’t open any of them to check that the right items had been received, I just put them in my carry-on so the original packaging was intact. Included were linear diffraction gratings, 1 cm plastic clear cuvettes, photocopies of the baseplate design on cardstock, batteries, and LEDs.

In May 2009, I went back to Vietnam to teach Chem 420, Instrumental Analysis, to the same undergraduate K51 class who took Chem 222 the year before. But this time, Vietnamese faculty had already taught much of the class content. Students were to present lectures; I gave only one lecture per day, and there were daily in-class projects, allowing the students to teach themselves. In many ways, with so much active learning, it was the best large-class teaching I ever did. Nguyen Thi Thai, one of the HUS faculty, videoed many of the lectures. It was not at all clear that I would ever return, and Thai wanted to ensure that at least some of the lectures were preserved for future classes.

And so the day came, May 21, 2009, when we took out the components for the students to assemble and play with, to see how diffraction gratings worked in the rudimentary spectrometer. They were supposed to collect spectrometer data using their cameras or cell phones. The plan for using the software was a little vague; I hoped they would download the software at home or bring the data back the next day on a thumb drive so it could be processed on my laptop.

We opened up and distributed the batteries. Out went the LEDs. Out went the other components. And then came the surprise. Edmund Scientific had sent double dispersion gratings instead of linear dispersion gratings. I was stunned – I’d never seen such gratings before. They diffracted light in both the x and y directions. But I quickly recovered. “Good thing I made that software flexible,” I thought. “We can handle light no matter what orientation it diffracts in. Good job!” The students, at least in the front portion of the room, seemed very involved, they were having so much fun actually making instruments with their own hands.

Students working with the rudimentary spectrometer – precursor to the SpectroClick Kit, May 21, 2009, VNUS-H.
Three students working with Prof. Scheeline, May 21, 2009, VNUS-H.

Pictures are stills from a video made by Prof. Nguyen Thi Thai, VNUS-H.

The SpectroClick Origin Story Part 1 : One Trip Turns into Two

SpectroClick President Alex Scheeline
In 2008, I took my first trip to Asia. For decades, I thought my first trip there might be to Japan, where I had some research associates. Instead, I went to Hanoi, Vietnam to teach Chemistry 222, Quantitative Analysis, as part of a collaboration between the Faculty of Chemistry, Vietnam National University of Science – Hanoi (VNUS-H), and the Department of Chemistry at the University of Illinois at Urbana-Champaign (UIUC), where I was Professor of Chemistry.

We compressed the entire semester class, the same course as the UIUC class with 28 lectures, into two weeks with three hours of lecture per day – intense and grueling for both professor and students. Thirty-seven eager students in the K51 class awaited – they were sophomore undergraduate students, mostly around 21 years old, because their first year at VNUS-H was intensive English in preparation for the rest of their classes, all taught in English

The classroom in Hanoi, built by the French prior to 1940, was an old style lecture hall with tiered seating. In the front row, the students appeared to have the usual expressions of expectancy, but not so obvious was an unusual level of competency. By the end of those two weeks, I found that these were some of the best students I had ever had the pleasure of teaching. Among them were at least 12 future Ph.D.s. Of course, I couldn’t yet know that.

In contrast to their classroom abilities, the students lacked exposure to laboratory instrumentation. None of them had ever had their hands on any instrument aside from an analytical balance. None had seen live, in-class demonstrations. They had laboratory experience, but it was not integrated with lectures. In the United States, in-class demonstrations are common (a practice going back at least to Michael Faraday in nineteenth century England). When I asked my Vietnamese colleagues for materials to demonstrate pH indicators in front of the class, it caused a minor revolution. But I was able to do this, and bringing a spectrophotometer from the research lab to the lecture hall was greeted with enthusiasm by the students. However, I was not allowed to move additional equipment from the faculty research lab to the classroom. They were fearful that moving the one precious potentiometer would break it, preventing the faculty from conducting research.

One of the front row students was Bùi Anh Thự, a young woman who said little, and didn’t appear to be one of the “gunners.” Had she not asked to have her picture taken with me that first May (as did other students), she would have been just part of the passing crowd.

Bùi Anh Thự and A. Scheeline, May 2008, Faculty of Chemistry, Hanoi. Picture by Dao Ha Anh.

At the end of the course, the VNUS-H Dean of the Faculty of Chemistry asked, “When are you coming back to teach Instrumental Analysis, Chemistry 420?” I squirmed. How can instrumental analysis be taught to students who have never used instruments, and who will have no instruments in class? I said I’d think about it, and as I flew out of Hanoi, I was far from convinced I would ever return.

By November, 2008, it was clear that the faculty in Hanoi really wanted Chem 420 to be taught, and I was the obvious person to do it. “How did I learn instrumentation?” I asked myself. “By building instruments.” Let’s see – what could we have these students build? A chromatograph? No, they’d need to pack columns, have detectors, and have injectors; which would be impractical. What about cyclic voltammetry or some other amperometric electrochemical technique? Too expensive; I was given no budget for supplies and I’ll have to do all this out-of-pocket.

Hmm. What about spectrophotometry?” At this point, I remembered that in the back of the Berkeley Physics Series, Volume 3 (Waves) there were some cheap optical components, including a diffraction grating in a 2” × 2” cardboard mount. I pulled the book off the shelf in my office, and sure enough, just as I had left it in the winter of 1972, there was the grating. “What could we use for a light source?” Maybe a white LED and a battery. We could fold up some paper to hold the LED at the correct height. The gratings are easy to obtain, and plastic cuvettes are 25 cents apiece. So we have everything for a crude spectrophotometer except for the detector.

What could we use for the detector? And then it hit me: many of the Vietnamese students had digital cameras. A few had cameras in their cell phones, and both of these cameras made JPG files. “If I can write software to use the JPGs to do quantitative work, that should be everything needed! The students already have the detectors!” And in a flash, the rudimentary spectrometer that would become the SpectroClick Kit was born. Almost immediately, anyone who heard of the idea blurted out the iPhone slogan, “there’s an app for that!” Little did I know that patent 7,420,663 was lurking, covering all cell phone spectrometry. But why would it matter? I thought that the 8 bit cameras in cell phones had such poor dynamic range and stability that they couldn’t be used for calibrated measurements.

spectro-burst

Technology Overview

spectro-burstSpectroClick seeks to allow every person on earth to measure the makeup of water, soil, and biological samples for themselves.  Is your water safe to drink?  Do you have an infection?  Is there enough phosphorus in the soil?  Use our instruments and reactant packets and find out!

SpectroClick puts spectroscopy  in the palm of your hand with the Answers At Hand™ AAH line of spectrometers.  Anyone with access to a USB port can use our patent-pending SpectroBurst™ technology, from a researcher testing drinking water in Africa to a high school student doing a science project in Alabama.  SpectroBurst™ uses a webcam to capture data, then our app allows you to process your spectrum quickly, comprehensively, and with more flexibility and portability than has ever been available before.  AAH spectrometers are the most affordable, accurate, and innovative spectroscopic instruments available.